
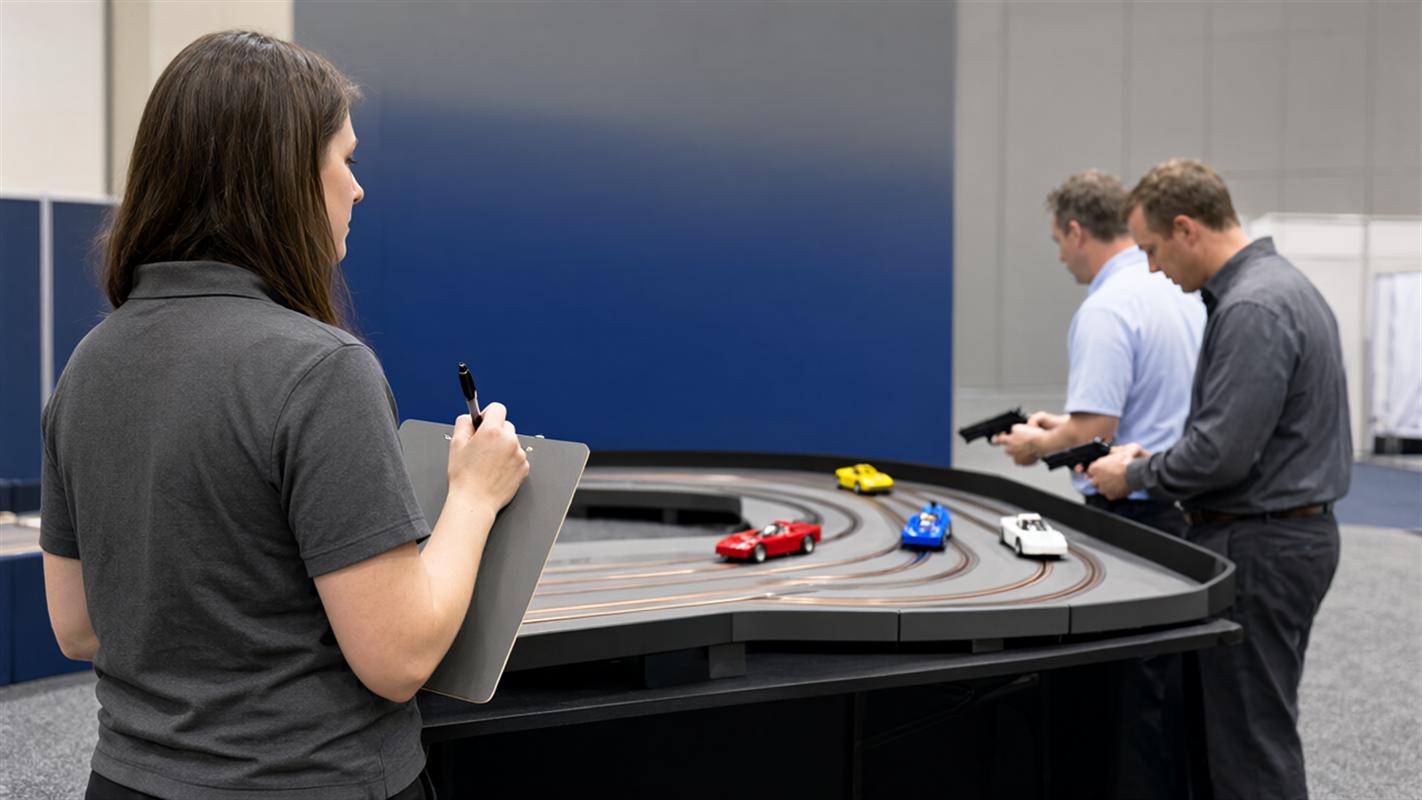
At a trade show, a booth that pulls a crowd is easy to see and hard to justify three months later. By the time the budget conversation happens, the aisle has emptied, the photos sit in a shared folder, and someone asks what the spend actually produced. Activity is not evidence. What makes an interactive attraction defensible is a small set of numbers agreed in advance, recorded while the hall is open, and written up in a report that makes sense to a reader who was not there. The framework below covers the measures worth tracking, the definitions that keep them honest, a day-of log that takes minutes to fill in, and the questions to ask of any report that arrives afterwards. It applies to any hands-on attraction, including a booth traffic generator built around racing.
Why Booth Engagement Metrics Need a Denominator
Numbers from a show floor arrive without context. Three hundred participants across three days sounds busy until you learn that 12,000 people walked the hall. The same total at a regional show with 2,000 attendees tells a rather different story. Neither figure means much alone, because a count describes the crowd rather than the performance.
The missing piece is the denominator: how many people passed the booth, and how many of them belong to the audience the booth was built for. Once both numbers exist, the result is a rate, and rates can be compared across hours, days and shows. A rate also survives a change of hall size, which a raw count does not. That habit of dividing before reporting is the first discipline, and it is the step most debriefs skip. Decide the denominator before anyone starts counting, not after the numbers come in.
The Trade Show Activation Metrics Worth Tracking
Seven measures cover a booth activation without turning the show into a data-entry exercise. Each needs a definition written down before the doors open, because a metric defined after the fact tends to be a metric chosen to flatter the result.
- Stop rate: the share of attendees passing the booth who stop, counted in fixed time blocks such as fifteen minutes.
- Participation rate: the share of people who stopped who actually took part.
- Dwell time: minutes from the first stop to the end of the conversation, reported as a median.
- Contact capture rate: contacts recorded divided by participants.
- Qualified conversation rate: contacts that met criteria agreed before the show, such as a real need, a timeline and a route to a decision.
- Cost per qualified conversation: total activation spend divided by qualified conversations.
- Follow-up rate: meetings or proposals booked within an agreed window after the show closes.
Throughput belongs beside those figures because of how a racing attraction runs. Heats of one to two minutes across several lanes, with more than one track in play, keep a line moving, and a single activation can serve groups from roughly 20 to 500-plus people across a show day. Participants per hour and queue wait turn that logistics into numbers a planner can schedule around, which is why they sit in the metric set rather than in the vendor’s notes.
Dwell Time Is a Median, Not an Average
One long conversation in a quiet hour can lift an average enough to hide the queue that formed at eleven. Averages reward the outlier and bury the pattern. When dwell is reported as one of your booth engagement metrics, ask for the median, the longest visit and the shortest, and take the sample size with them.
Collecting it is simpler than it sounds. Record a time in and a time out for a sample of visits across the day, thirty or so is usually enough for a readable median, and have one person note them on a phone rather than reconstructing the day from memory. A median that sits close to the length of one heat tells you people raced and moved on. A median well above it tells you the conversation after the race was doing the work, which is the part of the booth the activation was there to create.
Participation Rate Is Where Formats Show Up
The format decides who takes part. A fastest-lap contest suits a steady queue and a short attention span. Qualifying into a final gives people a reason to come back at two o’clock, and brackets with branded prizes reward a longer stay. Branding placed on cars, barriers, banners and scoring displays does similar work from a distance, because a spectator reads the sponsor before deciding whether to join the line.
Read the drop-off between stopping and racing as a diagnostic. A large gap points at signage that does not explain the activity, a line that looks intimidating, or heats long enough that people decide not to wait. Compare the gap across the two busiest hours and the quiet ones. Often the format is fine and the staffing at peak is the real constraint, which is the finding a participation number is there to expose. If the attraction needs a different shape of activity altogether, the range of experiential marketing activation ideas for more leads is a fair place to compare formats before the next show.
Contact Capture Belongs to the Exhibitor
An operator can say how many heats ran, how many people raced, which hour was busiest and what the lap times looked like, because wireless microphones and video monitors carry live scoring and the screen holds each result as the heat ends. What an operator cannot say is whether the person who just set the fastest lap is a fit for the product. That answer needs a badge scan, a qualifying question and a CRM record, and all three belong to the booth team.
The split matters more than it appears. When the operator’s participant count and the exhibitor’s scan count come from different systems, the debrief turns into an argument about which number is right instead of a discussion about what to change. One shared definition settles most of it, usually the moment a badge is scanned rather than the moment someone picks up a controller. Race Directors handling delivery, setup, operation and breakdown free the booth staff for that conversation, but they do not replace it.
Cost per Qualified Conversation
Divide total activation spend by qualified conversations and the result is a figure that survives a budget review, provided the qualification criteria were named before the show. Leave the criteria until afterwards and the denominator drifts toward whatever the team can count, which is usually a scan total.
This is the metric a finance team will actually press on, and it is the one that makes a smaller campaign defensible. Forty conversations with people who have a genuine need and a decision to make can beat four hundred badge scans that nobody calls. Present both, then explain the gap. For the mechanics of moving a crowd toward that smaller, better number, the guidance on turning booth traffic into qualified leads covers the handoff from attraction to conversation.
What the Day-Of Log Should Record
A day-of log is the only record that will exist while the show is live, and it should be short enough that a busy booth team will actually fill it in. Six lines cover the ground, and the same sheet carries the setup conditions in its header: track footprint, whether the layout runs on battery or a standard outlet, and where the scoring display sits.
- Fifteen-minute stop counts through the busiest four hours.
- Participants per heat and per hour.
- Queue wait at peak.
- Entry and exit times for a sample of visits.
- Staff on the floor at peak, split between operating and talking.
- Notes on anything that interrupted the flow.
Assign one person per shift and set a reminder at the top of each hour. The log is what makes a set of trade show activation metrics checkable later, because it timestamps the numbers as they happened instead of leaving the booth team to reconstruct a three-day show from a photograph of a busy aisle.
What an Attraction Report Should Prove
A report earns its place when a reader who missed the show can follow it. That means four things in order: what the traffic looked like against the denominator, what engagement looked like once people stopped, what happened to the contacts afterwards, and what changed during the day when it changed.
A credible trade show attraction case study follows the same shape, with names, builds and the numbers that came out of them rather than adjectives. The report should also say what the operator would do differently on a second run. That paragraph is the one that separates an operating team from a rental desk, and it is usually the most useful page in the document.
Ten Questions to Ask About an Activation Report
Most reports are honest and still incomplete. These questions close the gaps without turning the debrief into an audit.
- Which denominator was used for stop rate, and how was it counted?
- Is dwell reported as a median or an average, and on what sample?
- Which numbers came from the booth team rather than the operator?
- What were participation and queue wait during the peak hour?
- How many participants matched the target account list?
- Where did the drop-off between stopping and talking happen?
- Did the data export into the CRM in a usable format?
- What did staffing look like at peak, and how did the line affect the booth?
- What would the operator change on a second run?
- What baseline are these numbers compared against?
Two answers are worth flagging when they are missing. A report with no baseline gives a reading rather than a trend, and a report that will not name the denominator is describing a crowd.
Key Takeaways
- A count describes a crowd; a rate describes performance.
- Agree the metric set and the qualification criteria before the show opens.
- Report dwell as a median and keep the sample size beside it.
- The operator owns participants and throughput; the booth team owns scans, qualification and CRM records.
- Cost per qualified conversation is the figure that holds up in a budget review.
Conclusion
Measuring an interactive activation is not a reporting chore bolted on after the show. It is a short list of numbers agreed early, a sheet filled in during show hours, and a debrief that asks the same ten questions every time. Read rates rather than counts, split data ownership in writing, and keep one baseline from show to show so the second event can be compared with the first.
Nomad Raceways runs portable slot car activations for trade show booths, corporate events and brand activations, locally and worldwide, with layouts from roughly eight by eight feet up to large custom builds. Request a quote to plan the setup and the numbers that will measure it.